R&D expenditure in percentage of the GDP
R&D expenditure means the actual use of funding available for purposes of research and development.
R&D expenditure data
One of the most important and most broadly used indicators of research, development and innovation statistics is the R&D expenditure relative to the GDP, which shows the amount spent on R&D activities in a given national economy. This includes the spending of the business sector in a given year, as well as expenditure of higher education institutions and research institutes. It also contains investment and cost data, irrespective of whether organisations used their own sources or state subsidy to finance their R&D activities.
In line with policy expectations after the setback in 2016 (published in 2017) the volume of R&D spending in 2017 considerably increased compared to the previous year, from HUF 427.2 billion to HUF 517.3 billion.
In the last 10 years, except for the decline last year, the volume of R&D spending at current prices has permanently increased to a lesser or higher degree. The actual use of R&D expenditure has increased by 21.1% compared to the previous year. In this increase the European Union and domestic sources used in the framework of the coherent system of funding competitions launched in 2015 are clearly reflected.
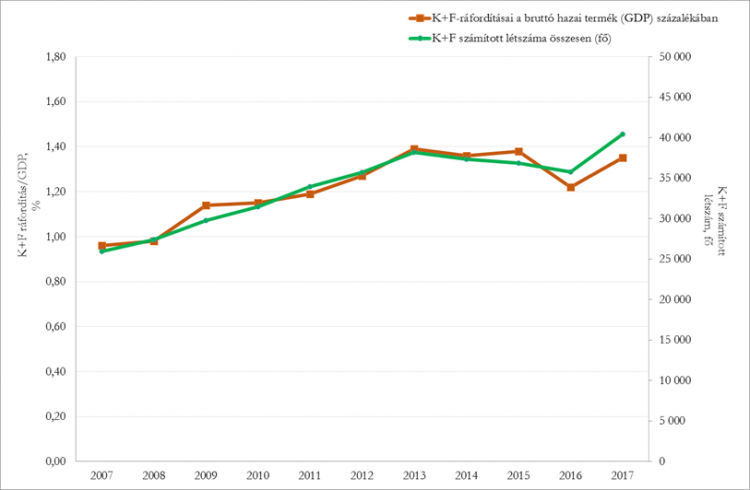
With the increase in the volume of R&D expenditure the R&D expenditure relative to the GDP reached 1.35% in 2017. Though this is a considerable progress compared to the previous year (1.22% - HCSO data of 2016), at the same time it is still behind the highest rate recorded in 2013, which was 1.39%, and it is significantly behind the target of 1.8% to be achieved by 2020.
 |
| Figure 1: R&D expenditure/GDP and R&D calculated headcount between 2007-2017 |
Logically, the increase of this rate does not only depend on R&D expenditure but on the volume of the GDP. The higher the GDP at a given R&D expenditure level, the smaller the R&D spending per GDP will be. This also means that in parallel with the growth of the GDP, the annual R&D expenditure needs to be increased to a higher degree for Hungary to achieve 1.8% by 2020.
R&D headcount data
As the above figure shows, the R&D expenditure relative to the GDP moves in tandem with calculated R&D staff. After the drop in 2016 the headcount of 2017 shows a major growth. The R&D calculated headcount increased from 35,757 (2016, HCSO) to 40,432. Compared to data of 2007 this is a one-and-a-half times higher headcount. So far, researchers’ headcount of 2013 was the highest, but even that is 2,000 people behind data of 2017. In the course of the increase in 2017 the number of researchers also increased significantly (by 10.2% compared to 2016), but the number of people in jobs supporting researchers has increased to a larger degree (19.9%).
Sources of R&D expenditure
The “sources of R&D expenditure” shows which sector provides funding for R&D activities. The data on expenditure is composed of the four sources below:
- business expenditure
- state budget
- non-profit funding
- foreign sources.
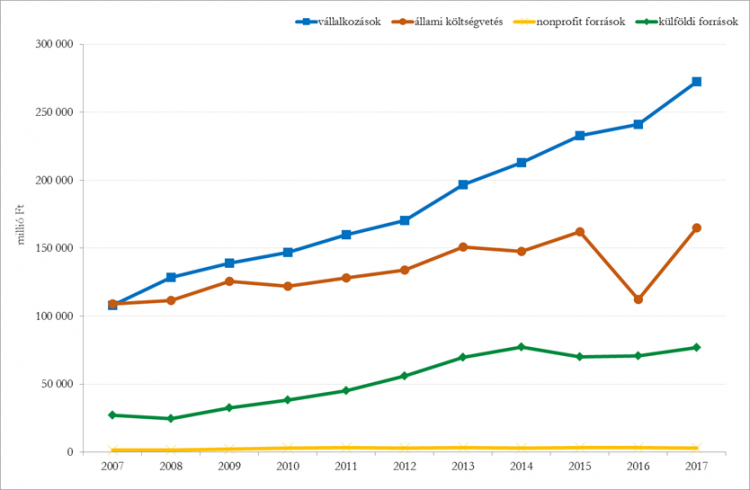
As for the data of 2017, the largest part of total expenditure, 53%, comes from businesses. The state budget provides 32%, whereas foreign sources provide 15%. The 0.5% of the expenditure comes from sources in the non-profit sector.
 |
| Figure 2: The distribution of R&D expenditure according to sources, 2007-2017 |
Examining the sources between 2007 and 2017, it is conspicuous that the weight of the business sector in R&D funding has increased significantly over the past 10 years. In 2007 business R&D and the R&D funding provided by the state budget were at the same level. In 2017 on the other hand, funding from the business sector is well ahead of budgetary sources.
Business R&D expenditures: The volume of BERD has been permanently on the increase and it is only the rate of growth that changes. In 2017 growth was extremely significant (13.0%), the growth rate of BERD was higher than that only in 2013 (15.3% compared to the previous year). It has to be noted that BERD does not contain the state subsidies provided to businesses for R&D projects, those are included in the data on public funding.
Budgetary (public) funding is not so balanced in time. The sector was characterised by smaller or larger downward movements earlier but the contribution of the public sector to R&D expenditure significantly dropped in 2016 compared to the previous year. It was partly due to the fact that the granting and payment of funds awarded to project proposals do not cover the same period as the spending of those grants. The data on expenditure is determined on the basis of use. This is also supported by the significant growth of public funding in 2017. Budgetary funding increased by 47.1% to HUF 164.9 billion in 2017, which is slightly above the level in 2015 at current prices (HUF 162 billion).
R&D expenditure used by the three sectors
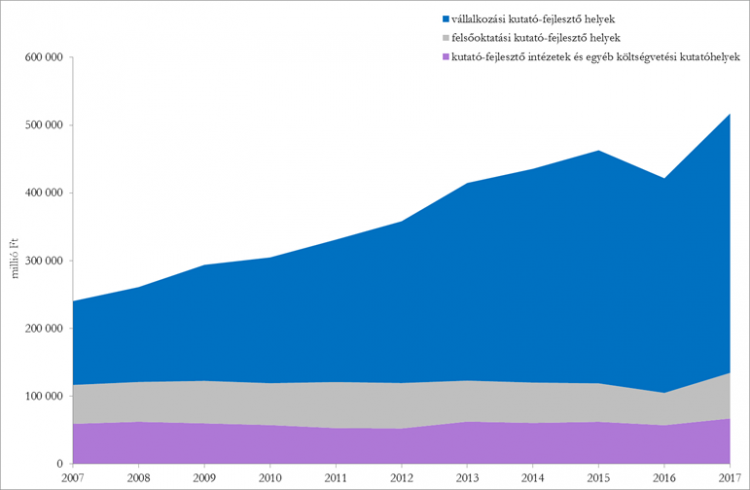
According to the preliminary data of the HCSO, 74% of R&D expenditure in 2017 was spent by the business sector. It includes the own resources of businesses and public funding from the state budget. Higher education institutions, budgetary and other research organisations (including the research institutes of the Hungarian Academy of Science and research institutes) were able to use 13-13% of R&D funding.
 |
| Figure 3: The use of R&D expenditure in three sectors between 2007-2017 |
It was the expenditure used by universities that proportionally has grown to the largest extent (by 41.2%) compared to the previous year. (It is worth noting that the expenditure used by universities and research institutes include not only R&D project funding, but also budgetary funding related to operation, i.e. the overheads and wage costs included in R&D activity.) BERD grew by 20.9%, whereas the R&D expenditure of research institutes increased by 17.4%. The previous data is identical with the growth of national R&D expenditure.
Further information:
-
Domestic innovation performance in light of the EU Innovation Scoreboard released in 2018
In the European Innovation Scoreboard (EIS) compiled by the European Commission Hungary, based on its total score, has made a slight improvement compared to last year. Last year significant changes were made to the methodology of the scoreboard, which are important to take into account when analysing the data in an informed way. The impact on research-development and innovation of the 5,700 projects granted funding in 2016 and 2017 and partly in 2018 will be reflected in the R&D expenditure-related data and innovation ranking in the next few years.
Article in full
-
Hungarian innovation performance in light of the Global Innovation Index 2018 (WIPO)
The Global Innovation Index (GII) compiled by the World Intellectual Property Organization (WIPO) uses 80 indicators in seven groups of indicators to describe factors which impact on research, development and innovation. In the overall ranking Hungary advanced to the 33rd from its ranking at 39th last year. The largest positive change was observed with respect to the indicator “University/business research collaboration”.
Article in full
-
R&D trends according to preliminary HCSO statistics
The HCSO published preliminary data on 2016 concerning the characteristics of domestic research and development activity: the amount of R+D expenditures, the ratio of R+D expenditure in % of the GDP, the distribution of expenditure broken down according to sources, more precisely public and business expenditure on R+D, furthermore, the number of research and development units and changes in the headcount of researchers.
Article in full


